Facebook
 X
X
 Pinterest
 Copy Link
This video is the latest in the Monday with Matthew series with Windermere Chief Economist Matthew Gardner. Each month, he analyzes the most up-to-date U.S. housing data to keep you well-informed about what’s going on in the real estate market. A big thank you to Matthew Gardner and the Windermere staff for getting updates like this out so we can stay informed.
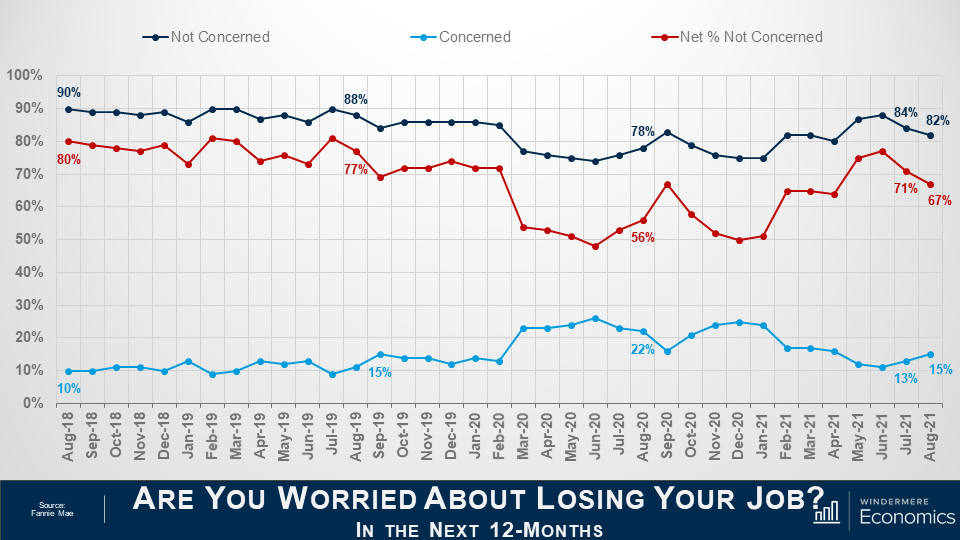
Hello there, I’m Windermere’s Chief Economist Matthew Gardner, and welcome to this month’s episode of Monday with Matthew. With home prices continuing to defy gravity, mortgage rates spiking, the Fed raising interest rates significantly, a yield curve that is just keeping its nose above water, and some becoming vocal about the possibility that we are going to enter a recession sooner rather than later, it’s not at all surprising that many of you have been asking me whether the housing market is going to pull back significantly, and a few of you have asked whether we aren’t in some sort of “bubble” again.
Because this topic appears to be giving many of you heartburn, I decided that it’s a good time to reflect on where the housing market is today and give you my thoughts on the impact of rising mortgage rates on what has been an historically hot market.
The Current State of the U.S. Housing Market
Home Sale Prices
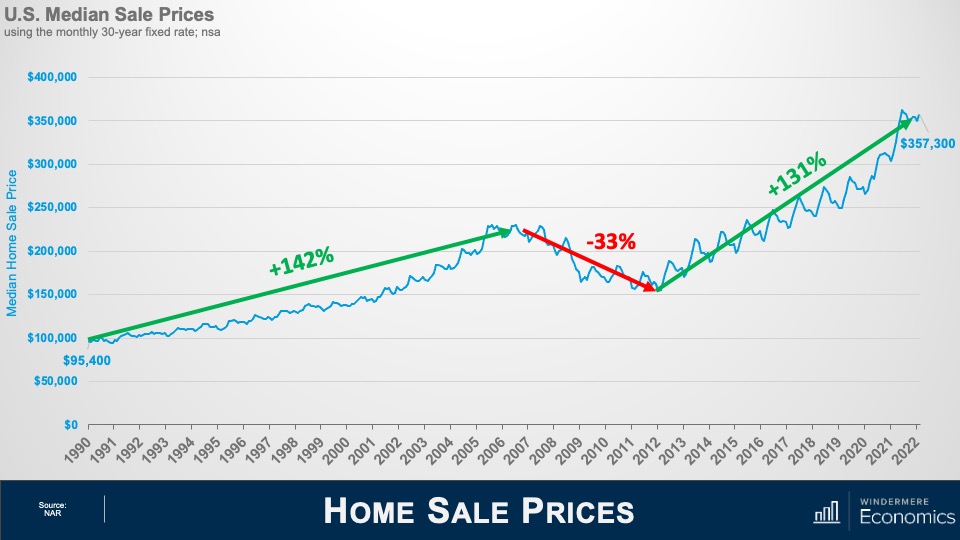
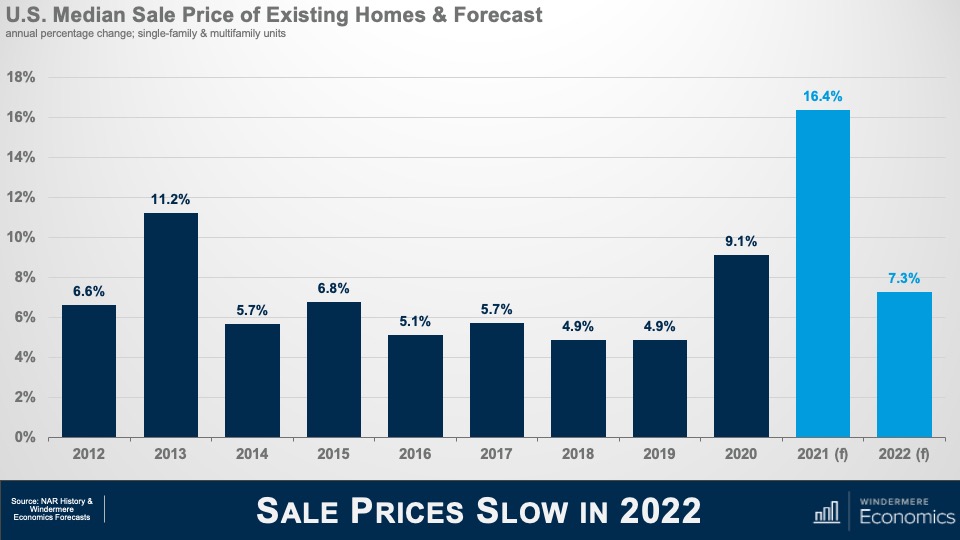
As usual, a little perspective. Between 1990 and the pre-bubble peak in 2006, home prices rose by 142%, which was a pretty impressive annual increase of 5.6% over a 16 1/2-year period. When the market crashed, prices dropped by 33%, but from the 2012 low to today, prices have risen by 131%, or at an even faster annual rate of 8.6% over a shorter period of time—10 years.
You may think that prices rising at an annual rate that exceeds the pace seen before the market crash is what has some brokers and home buyers concerned, but that really isn’t what has many people scared. It’s this.
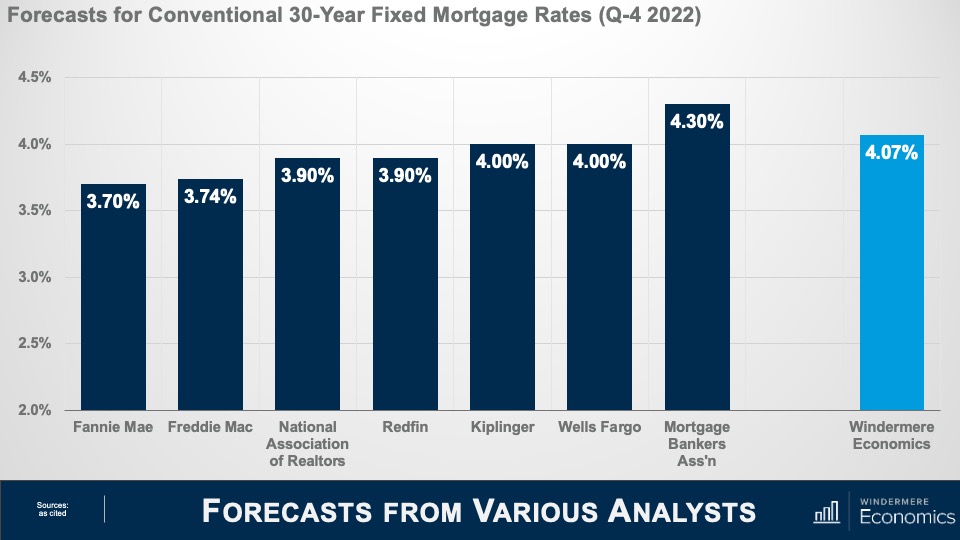
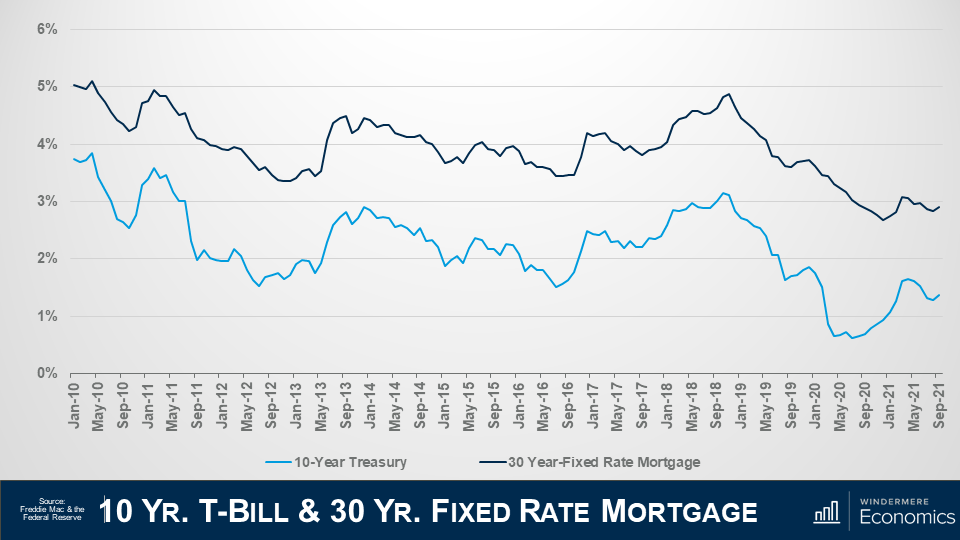
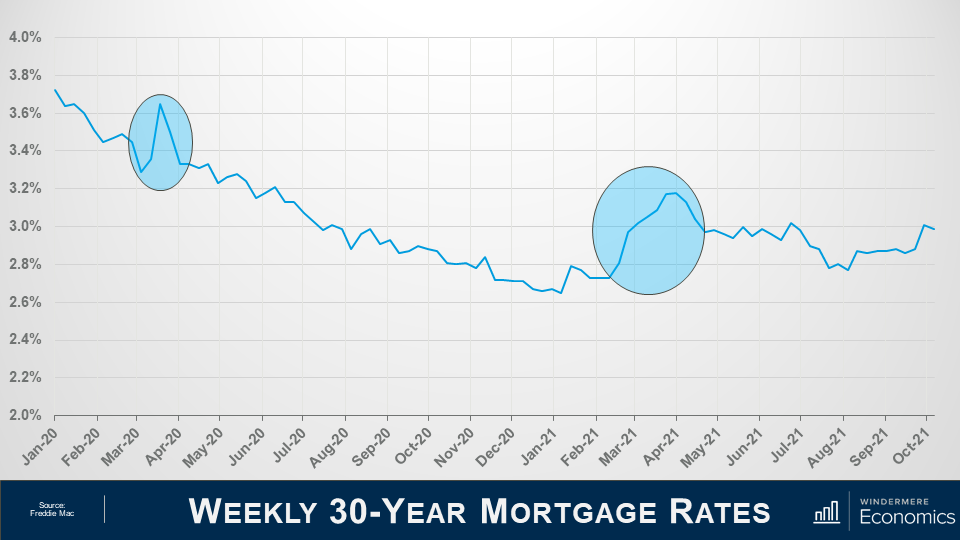
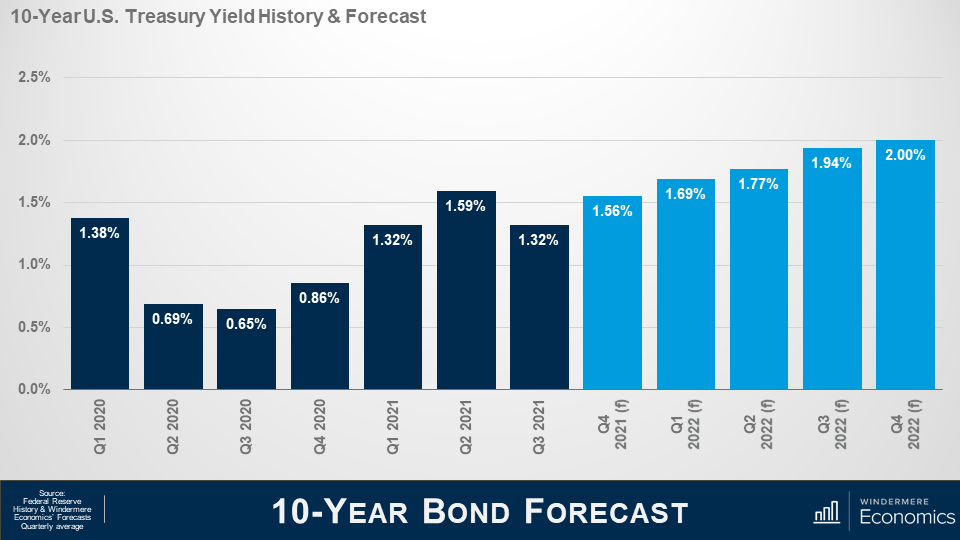
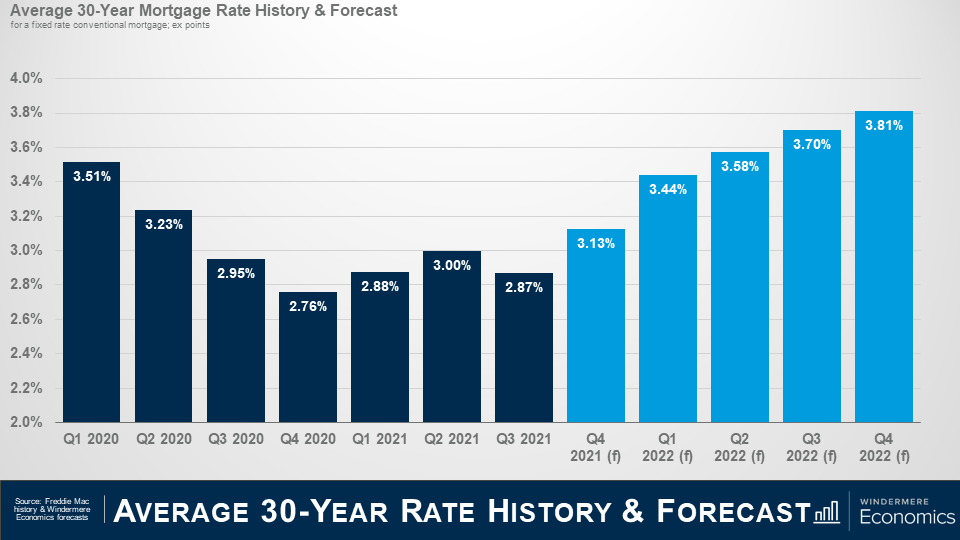
Mortgage Rates in 2022
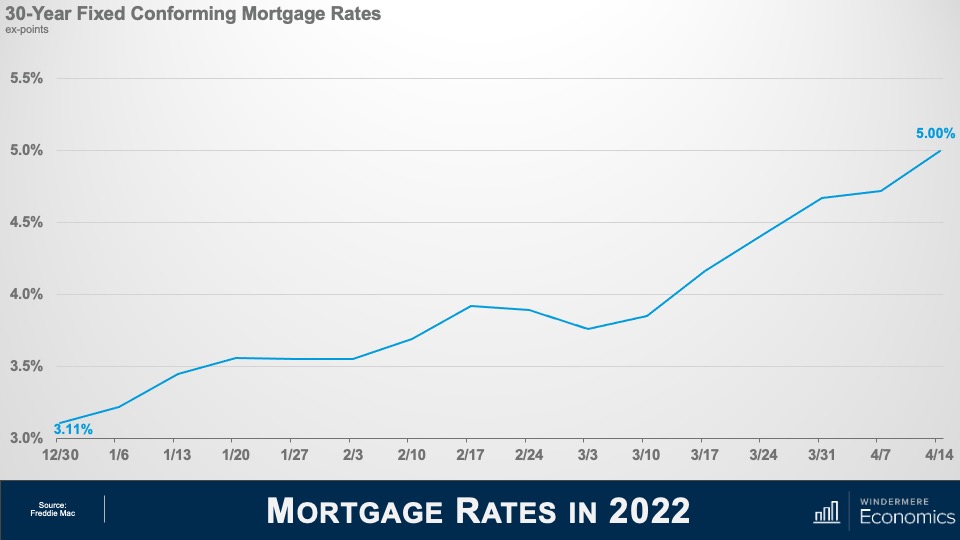
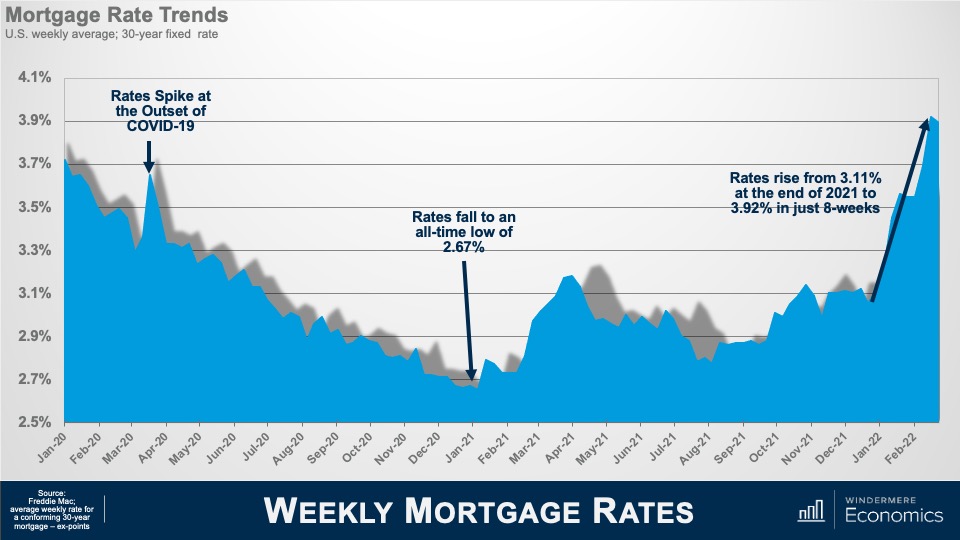
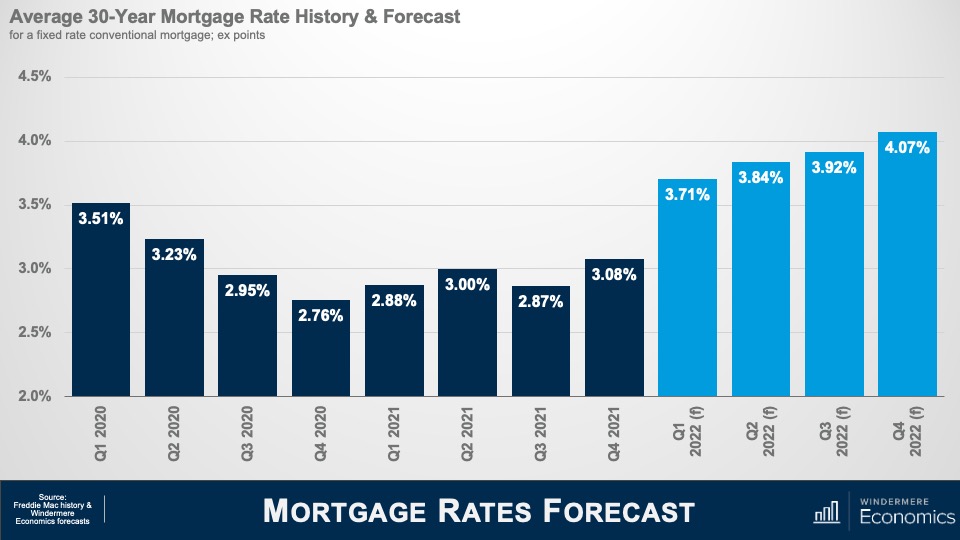
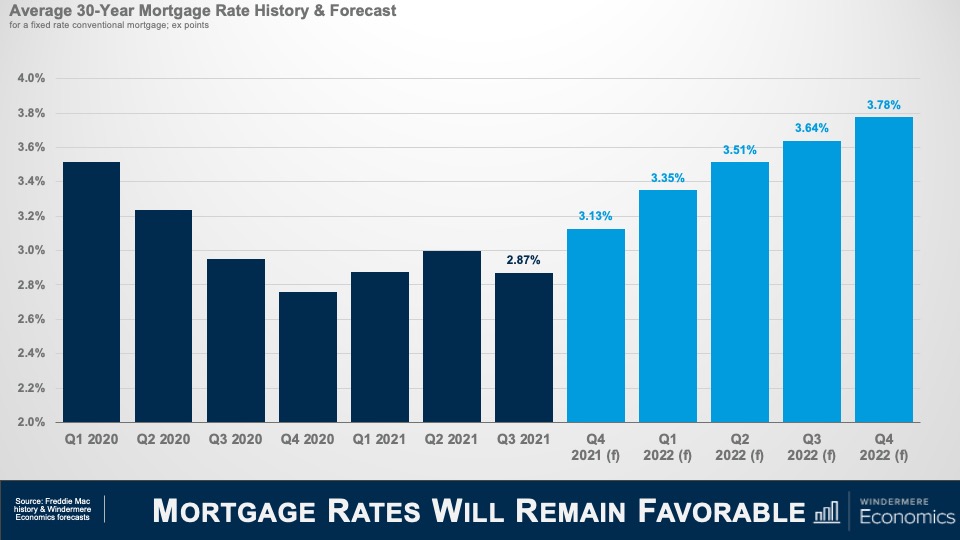
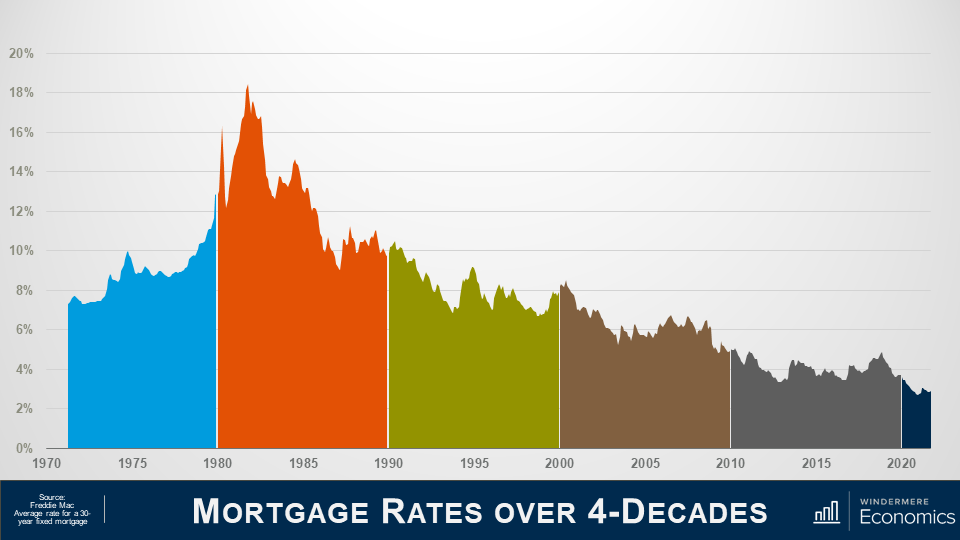
At the start of 2022, the average 30-year fixed mortgage rate was just a little above 3%. But, over a brief 15-week period, they have skyrocketed to 5%. This has led some to worry that the market is about to implode. Of course, nobody can say that the run-up in home prices hasn’t been phenomenal over the past few years, and it’s certainly human nature to think that “what goes up, must come down,” but is there really any reason to panic? I think not, and to explain my reasoning, let’s look back in time to periods when rates rose significantly and see how increasing mortgage rates impacted the marketplace.
Housing and Mortgage Markets During Times of Rising Rates
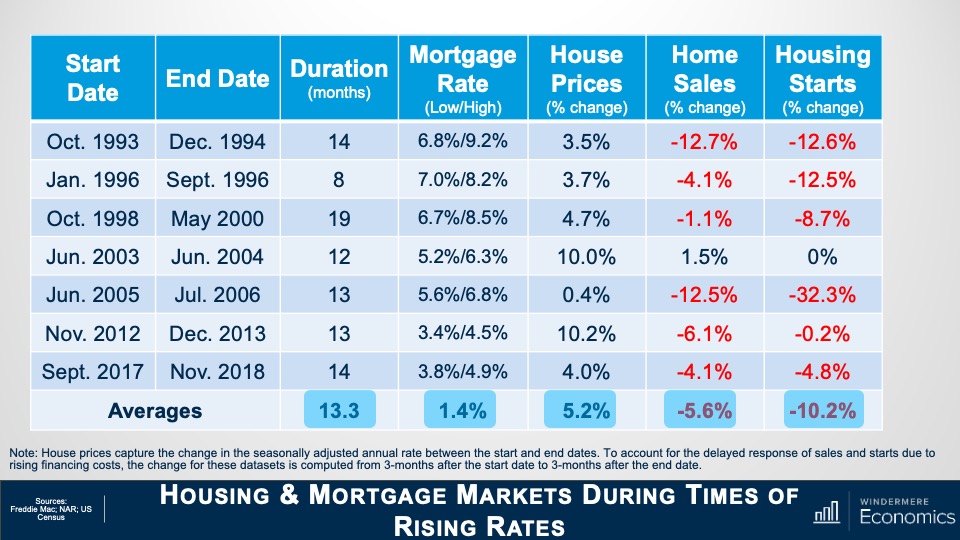
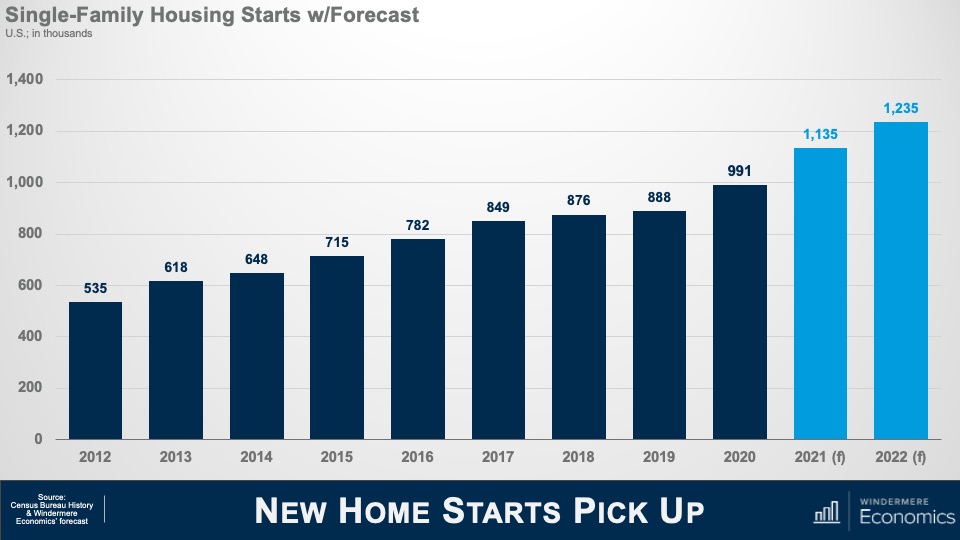
This table shows seven periods over the past 30 years when mortgage rates rose significantly. On average, rates trended higher for just over a year before pulling back, and the average increase was 1.4%. But now look at how it impacted home prices: it really didn’t. On average, during these periods of rising financing costs, home prices still rose by just over 5%. Clearly, not what some might have expected. But there were some negatives from mortgage rates trending higher, and these came in the form of lower sales in all but one period and new housing starts also pulled back.
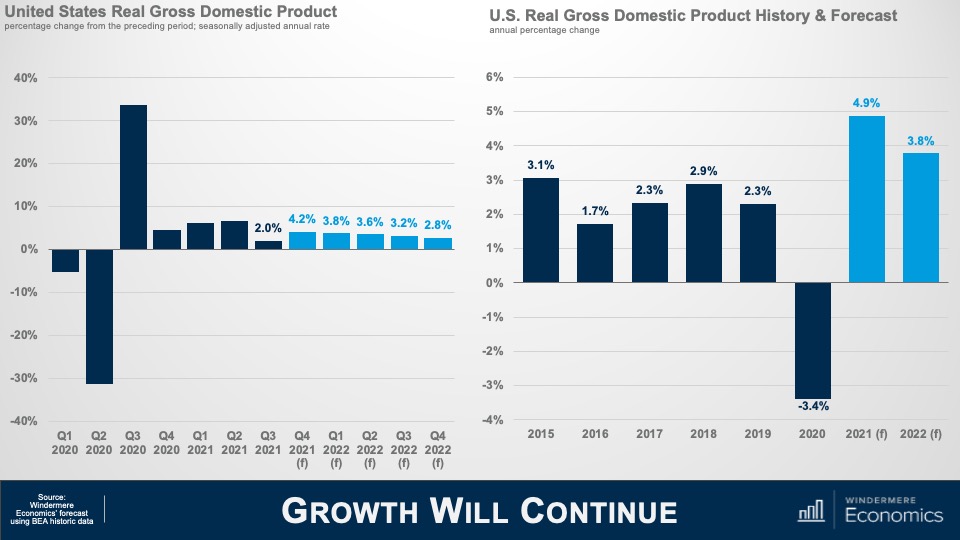
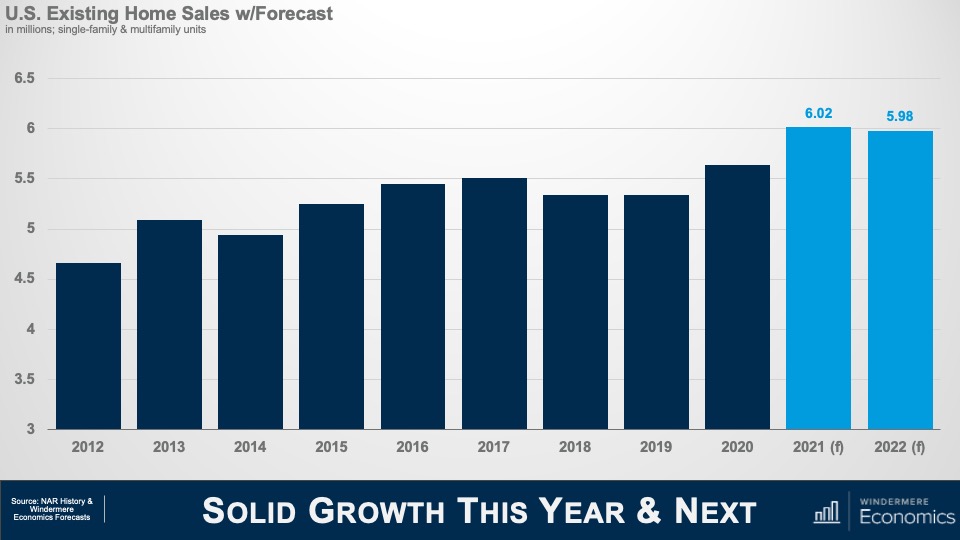
So, if history is any indicator, the impact of the current jump in mortgage rates is likely to be seen in the form of lower transactions rather than lower prices. And this makes sense. Although rising financing costs puts additional pressure on housing affordability, what people don’t appear to think about is that mortgage rates actually tend to rise during periods of economic prosperity. And what does a flourishing economy bring? That’s right. Rising wages. Increasing incomes can certainly offset at least some of the impacts of rising mortgage rates.
Static Equilibrium Analysis – 1/3
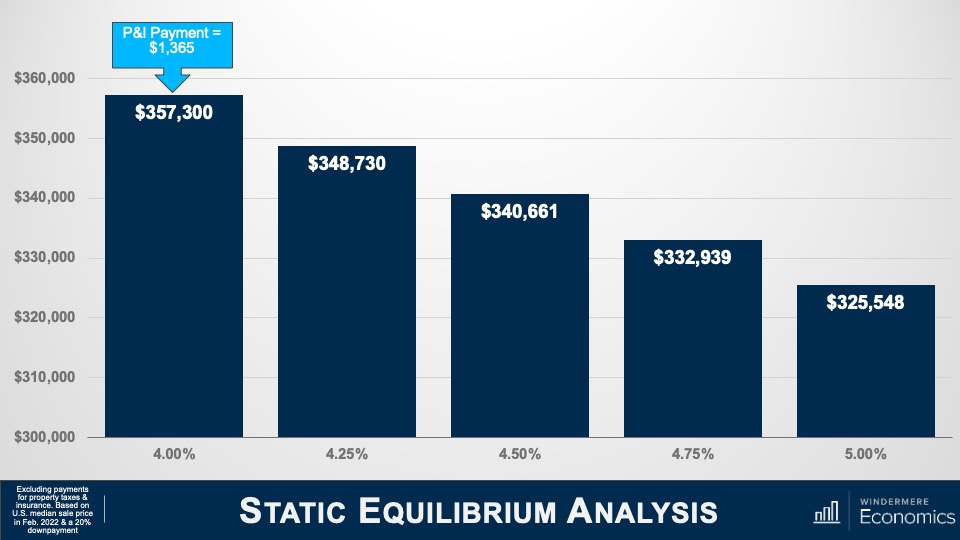
To try and explain this, I’m using the median US sale price in February of this year, assuming a 20% down payment and the mortgage rate of 4%. And you can see that the monthly P&I payment would be $1,365. But as mortgage rates rise, and if buyers wanted to keep the same monthly payment, then they would have to buy a cheaper home. Using a rate of 5%, a buyer could afford a home that was 9% cheaper if they wanted to keep the payment the same as it would have been if rates were still at 4%.
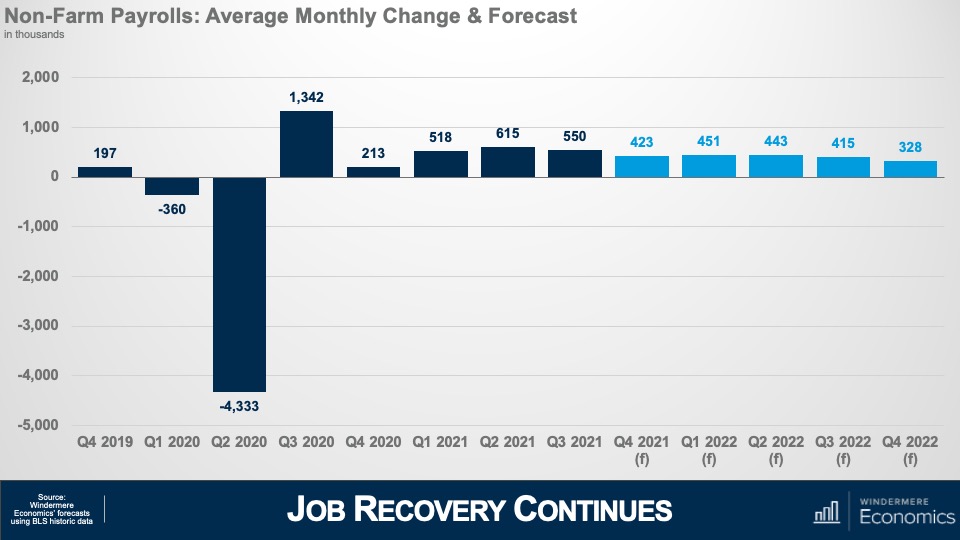
But, as I mentioned earlier, an expanding economy brings higher wages, and this is being felt today more than usual, given the worker shortage that exists and businesses having to raise compensation. Average weekly wages have risen by over five-and-a-half percent over the past year—well above the pre-pandemic average of two-and-a-half percent. Although increasing incomes would not totally offset rising mortgage rates, it does have an impact.
Static Equilibrium Analysis – 2/3
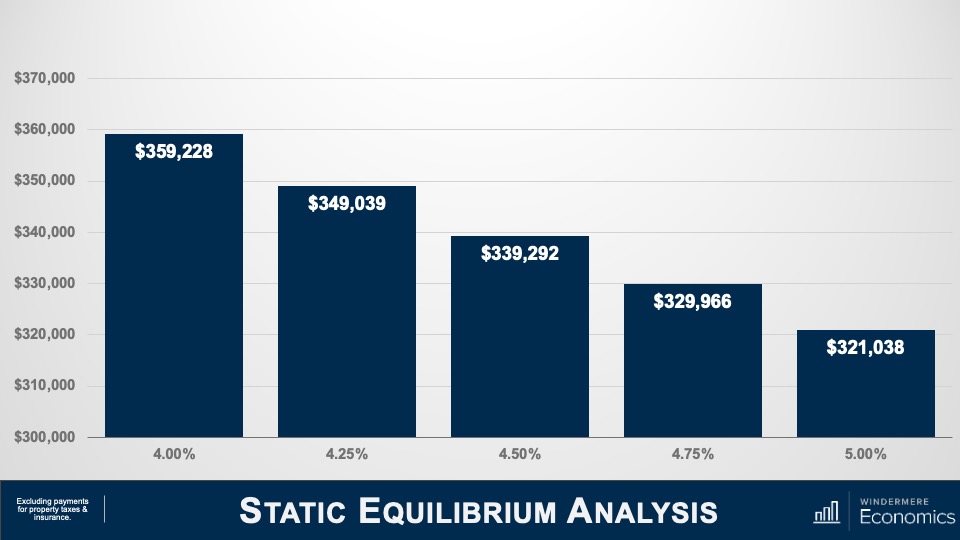
To demonstrate this, let’s use the U.S. average household income of $70,611. Assuming that they’ve put aside 20% of their gross income for a down payment, they could afford a home priced just under $360,000 if mortgage rates were at 4%. As rates rise—and assuming that their income doesn’t—their buying power is reduced by over 10%, or just over $38,000.
Static Equilibrium Analysis – 3/3
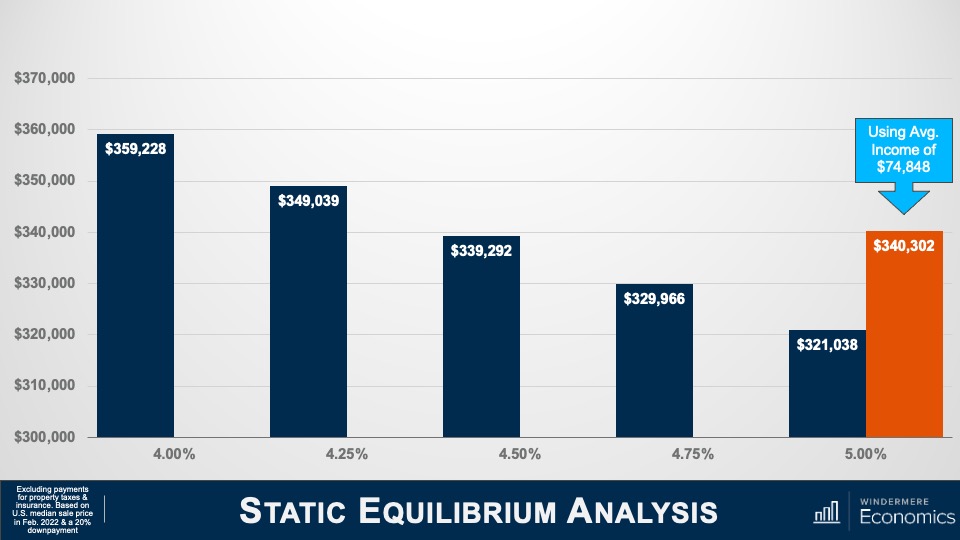
But if we believe that incomes will rise, then the picture looks very different. Assuming wages rise by 6%, their buying power drops by just 5% if rates rose from 4% to 5%, or a bit less than $19,000.
Although rates have risen dramatically in a short period, because they started from an historic low, the overall impacts are not yet very significant. If history is any indicator, mortgage rates increasing are likely to have a more significant impact on sales, but a far smaller impact on prices.
But there are other factors that come into play, too. Here I’m talking about demand. The only time since 1968 that home prices have dropped on an annualized basis was in 2007 through 2009 and in 2011, and this was due to a massive increase in the supply of homes for sale. When supply exceeds demand, prices drop.
So, how is it different this time around? Well, we know that the supply glut that we saw starting to build in mid-2006 was mainly not just because households were getting mortgages that, quite frankly, they should never have gotten in the first place, but a very large share held adjustable rate mortgages which, when the fixed interest rate floated, they found themselves faced with payments that they could not afford. Many homeowners either listed their homes for sale or simply walked away.
Although it’s true that over the past two or so months more buyers have started taking ARMs as rates rose, it’s not only a far smaller share than we saw before the bubble burst, but down payments and credit quality remained far higher than we saw back then.
So, if we aren’t faced with a surge of inventory, I simply don’t see any reason why the market will see prices pull back significantly. But even if we do see listing activity increase, I still anticipate that there will be more than enough demand from would-be buyers. I say this for several reasons, the first of which is inflation.
What a lot of people aren’t talking about is the proven fact that owning real estate is a significant hedge against rising inflation. You see, most buyers have a mortgage, and a vast majority use fixed-rate financing. This is the hedge because even as consumer prices are rising, a homeowner’s monthly payments aren’t. They remain static and, more than that, their monthly payments actually become lower over time as the value of the dollar diminishes. Simply put, the value of a dollar in—let’s say 2025—will be lower than the value of a dollar today.
But this isn’t the only reason that inflation can actually stimulate the housing market. Home prices historically have grown at a faster pace than inflation.
Hedge Against Inflation

This chart looks at the annual change in total CPI going back to 1969. Now let’s overlay the annual change in median U.S. home prices over the same time period. Other than when home prices crashed with the bursting of the housing bubble, for more than fifty years home price growth has outpaced inflation. And this means we are offsetting high consumer prices because home values are increasing at an even faster rate.
But inflation has additional impacts on buyers. Now I’m talking about savings. As we all know, the interest paid on savings today is pretty abysmal. In fact, the best money market accounts I could find were offering interest rates between 0.5% and 0.7%. And given that this is significantly below the rate of inflation, it means that dollars saved continue to be worth less and less over time while inflation remains hot.
Now, rather than watching their money drop in value because of rising prices, it’s natural that households would look to put their cash to work by investing in assets where the return is above the rate of inflation—meaning that their money is no longer losing value—and where better place to put it than into a home.
Housing as a Hedge Against Inflation
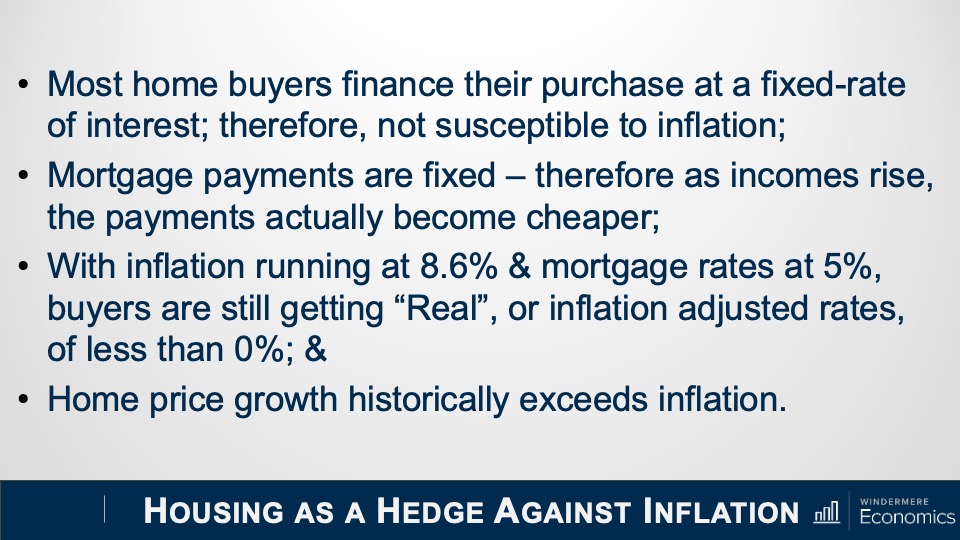
So, the bottom line here is that inflation supports demand from home buyers because:
- Most are borrowing at a fixed rate that will not be impacted by rising inflation
- Monthly payments are fixed, and these payments going forward become lower as incomes rise, unlike renters out there who continue to see their monthly housing costs increase
- With inflation at a level not seen since the early 1980s, borrowers facing 5% mortgage rates are still getting an amazing deal. In fact, by my calculations, mortgage rates would have to break above 7% to significantly slow demand, which I find highly unlikely, and
- If history holds true, home price appreciation will continue to outpace inflation
Demand appears to still be robust, and supply remains anemic. Although off the all-time low inventory levels we saw in January, the number of homes for sale in March was the lowest of any March since record keeping began in the early 1980’s.
But even though I’m not worried about the impact of rates rising on the market in general, I do worry about first-time buyers. These are households who have never seen mortgage rates above 5% and they just don’t know how to deal with it! Remember that the last time the 30-year fixed averaged more than 5% for a month was back in March of 2010!
And given the fact that these young would-be home buyers have not benefited from rising home prices as existing homeowners have, as well as the fact that they are faced with soaring rents, making it harder for them to save up for a down payment on their first home, many are in a rather tight spot and it’s likely that rising rates will lower their share of the market.
So, the bottom line as far as I am concerned is that mortgage rates normalizing should not lead you to feel any sort of panic, and that current rates are highly unlikely to be the cause of a market correction.
And I will leave you with this one thought. If you agree with me that a systemic drop in home prices has to be caused by a significant increase in supply, and that buyers who are currently taking out adjustable-rate mortgages are more qualified, and therefore able to manage to refinance their homes when rates do revert at some point in the future, then what will cause listings to rise to a point that can negatively impact prices?
It’s true that a significant increase in new home development might cause this, but that is unlikely. And as far as existing owners are concerned, I worry far more about a prolonged lack of inventory. I say this for one very simple reason and that is because a vast majority off homeowners either purchased when mortgage rates were at or near their historic lows, or they refinanced their current homes when rates dropped.
And this could be the biggest problem for the market. Even if rates don’t rise at all from current levels, I question how many owners would think about selling if they were to lose the historically low mortgage rates that they have locked into. It is quite possible that for this one reason, we may experience a tight housing market for several more years.
As always, if you have any questions or comments about this particular topic, please do reach out to me but, in the meantime, stay safe out there and I look forward to visiting with you all again next month.
Bye now.